Check Please!
This dataset contains information about food, the waiter or waitress, and tipping. Oftentimes this is a common dataset for teaching machine learning. This dataset is a classic for learning data visualization because it’s straightforward but contains a good mix of categorical and numerical data.
Dataset Structure
| Attribute | Type | Description |
|---|---|---|
| total_bill | Numerical | The total cost of the meal (including tax) in USD. |
| tip | Numerical | The gratuity amount left by the diner in USD. |
| gender | Categorical | The gender of the person paying for the meal (Male or Female). |
| smoker | Categorical | Whether there were smokers in the party (Yes or No). |
| day | Categorical | The day of the week (Thur, Fri, Sat, or Sun). |
| time | Categorical | The time of day (Lunch or Dinner). |
| size | Numerical | The number of people in the dining party. |
Lab Questions
- Build a model that takes in the size and total_bill as inputs, and predict the estimated tip.
- Build a model that takes in the gender and total_bill as inputs, and predict the estimated tip.
- Make a box plot to compare the gender of the waiter versus the total tip. Do men or women get more tips? Does this seem fair?
- Using the model constructed in step 3, do a single prediction, compare a total bill of 200$ if the waiter is Male versus Female. Does you model have gender bias? Discuss whether the model’s behavior could be categorized as sexist.
Sources:
The dataset is from the seaborn python library. dataset source available here
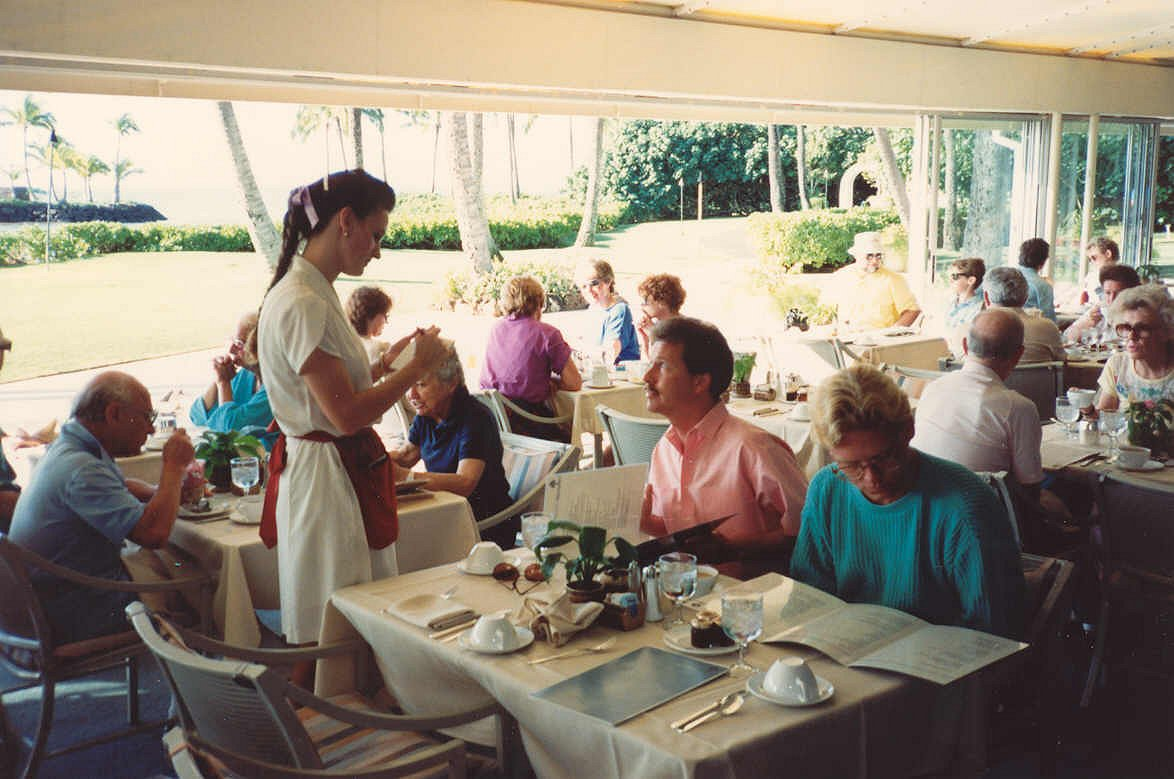
The image is from wikipedia and was taken by Alan Light in 1989.
