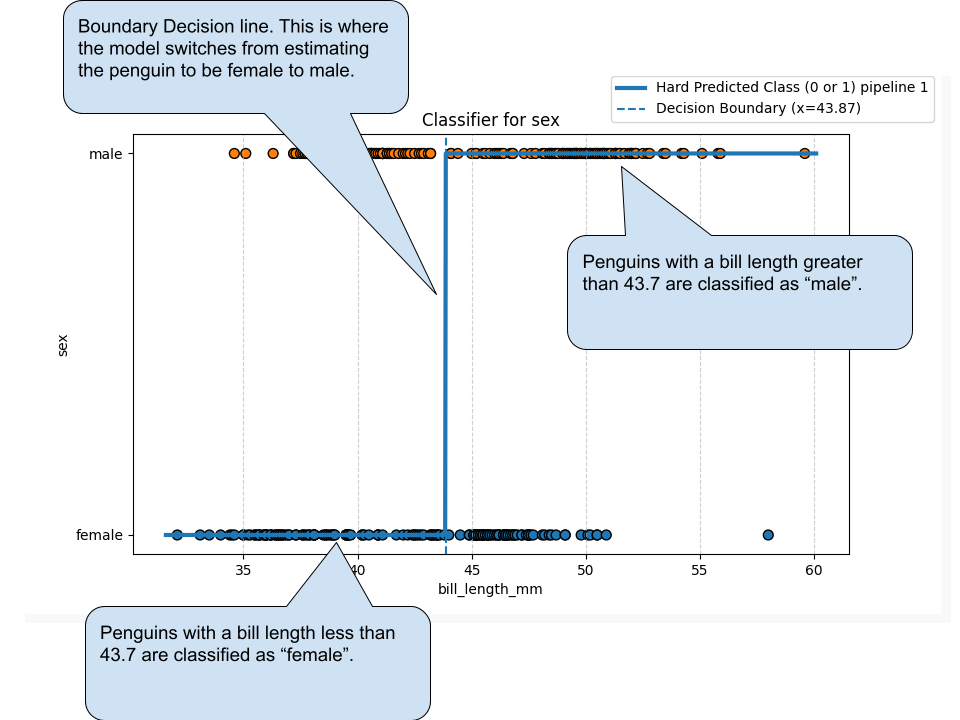
2D Classifiers is where you have a single input, and a single output. This can be represented on a 2 dimensional plane or peice of paper. Below is an example of the penguins dataset, where we are classifying sex based on the bill length of the penguin.
The accuracy metrics and chart for this will be the same as any other of the Classifiers.
Plotting setup
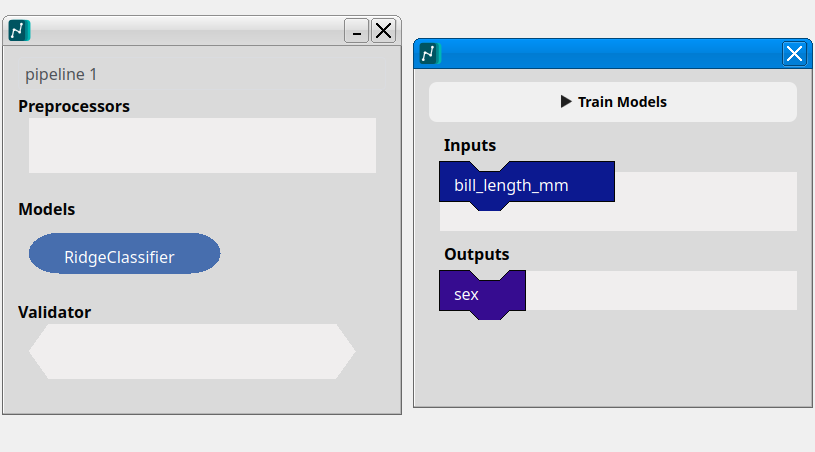
Chart Results
This is a Hard Prediction Plot, which visualizes the model’s decision logic. It maps specific input values to their predicted categories, showing exactly where the model switches its classification from one class to another.