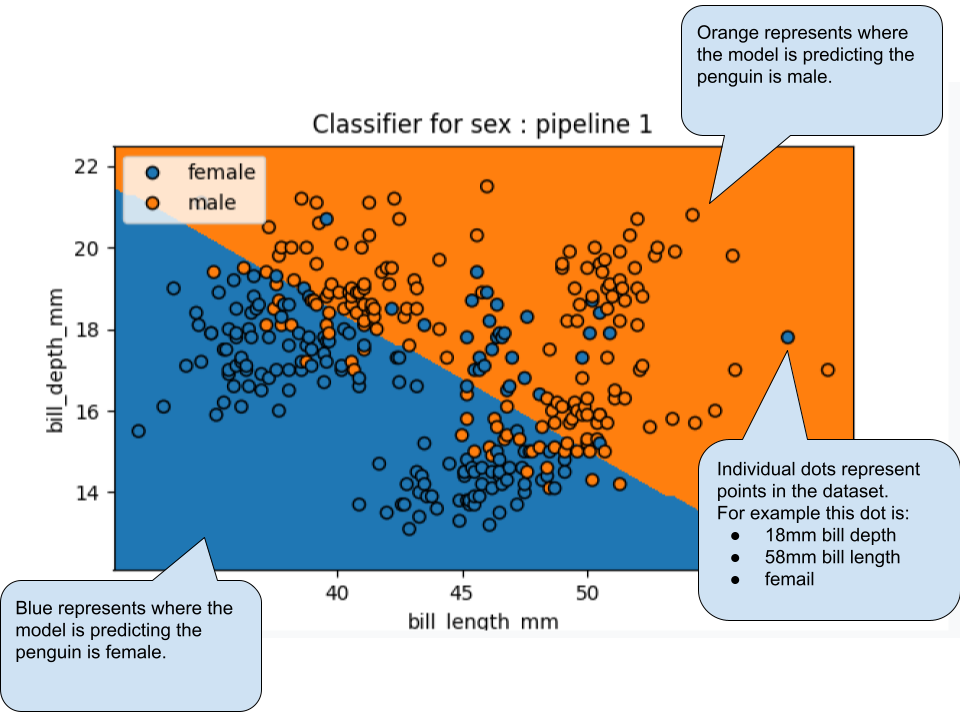
A this is one the main function of Classifiers. This displays the classification boundaries as a map, showing the different ways that your model is partitioning the dataset.
Plotting setup
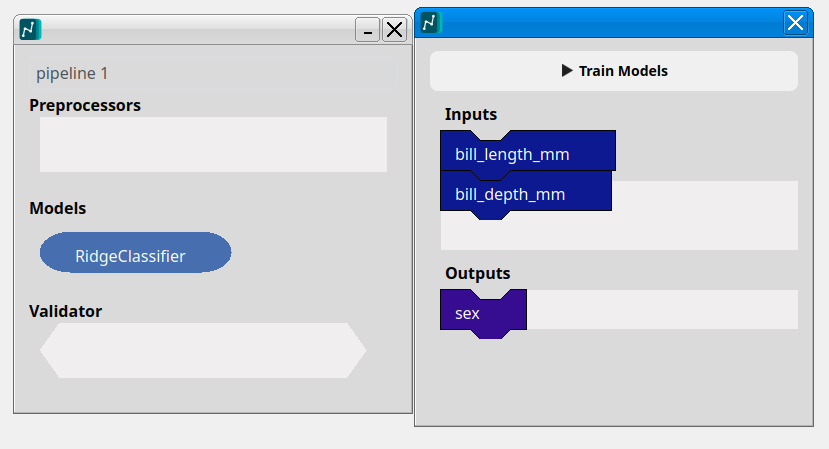
Chart results
The result is a classification scatter plot. These can be used to visualize the model’s decision logic. It maps specific input values to their predicted categories, showing exactly where the model switches its classification from one class to another.