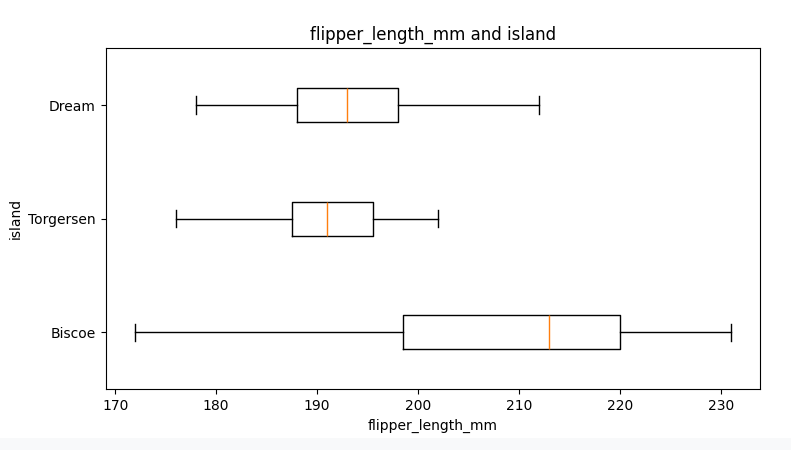
The box and whiskers plot is an easy way to view data at a glance, and get the general relationship between a category and a data value.
How to
- Remove all models
- Put a numerical value in the input column. Then put a categorical value in the outputs.
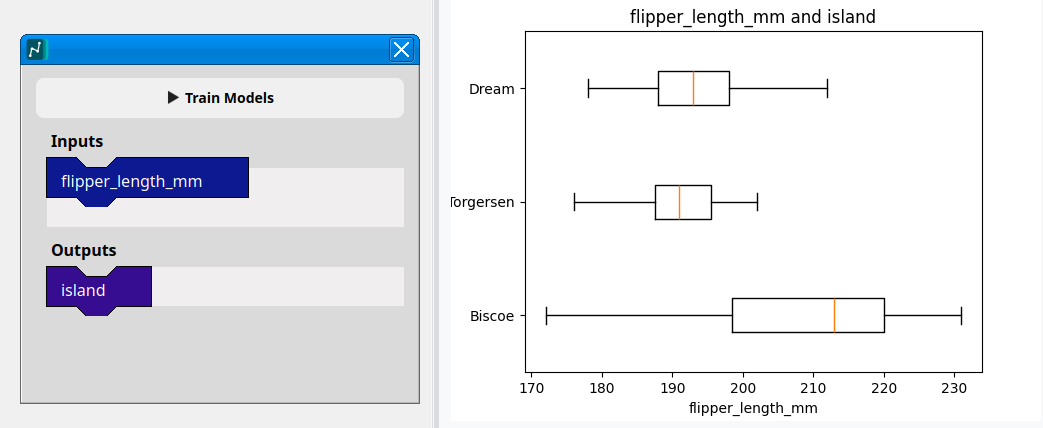
- Click “Train models!”