Upon loading into the app you will be greeted with the main menu. Here you can access example datasets, as well as any recent datasets you have saved on your computer. Each item under the example datasets is clickable, and will open the respective example dataset.
For this demo click on the penguins dataset.
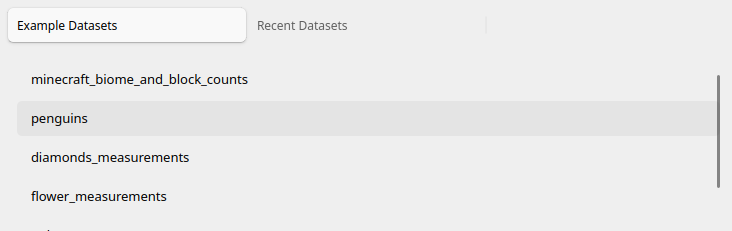
After clicking on the penguins dataset, you will see the main project screen. This represents where you engineer and modify your AI models.
Dataframe Basics
Each “row” in the dataset corresponds to an item in that dataset. Since this example is using the penguins dataset, each row corresponds to a penguin.
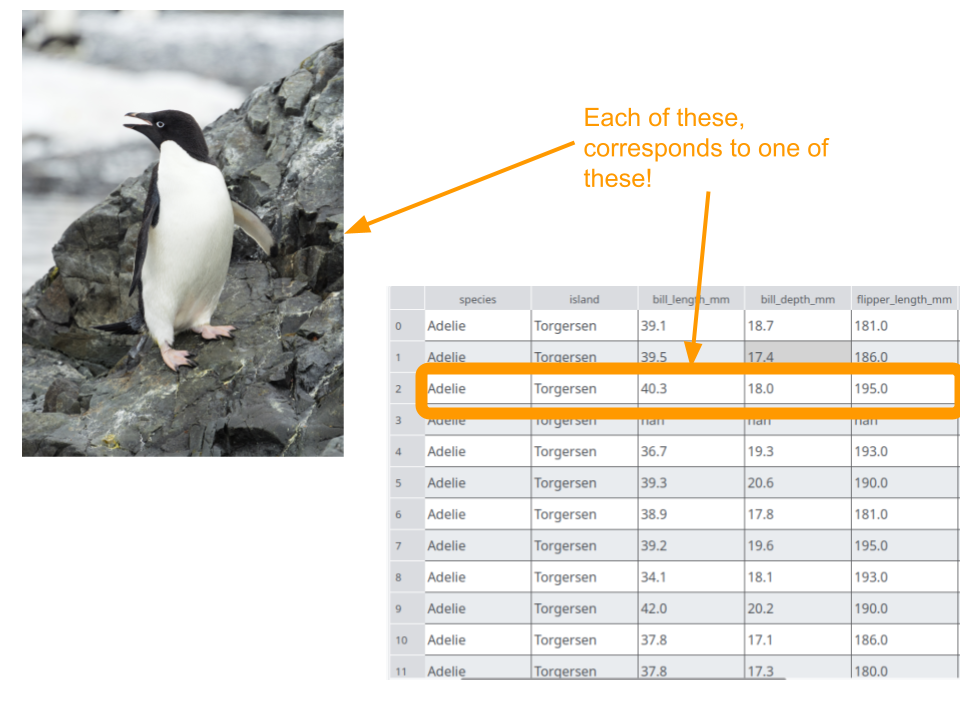 Each “Column block” corresponds to a “column” on the dataset you are using! This is how we determine which parts of the dateset are ignored, used as training data, and what we are trying to predict!
.png)
Plotting and Controls
Okay, lets try some plotting first!
- Drag and drop the
bill_length_mminto the inputs section. - Drag and drop the
bill_depth_mminto the outputs section. - Click Run!
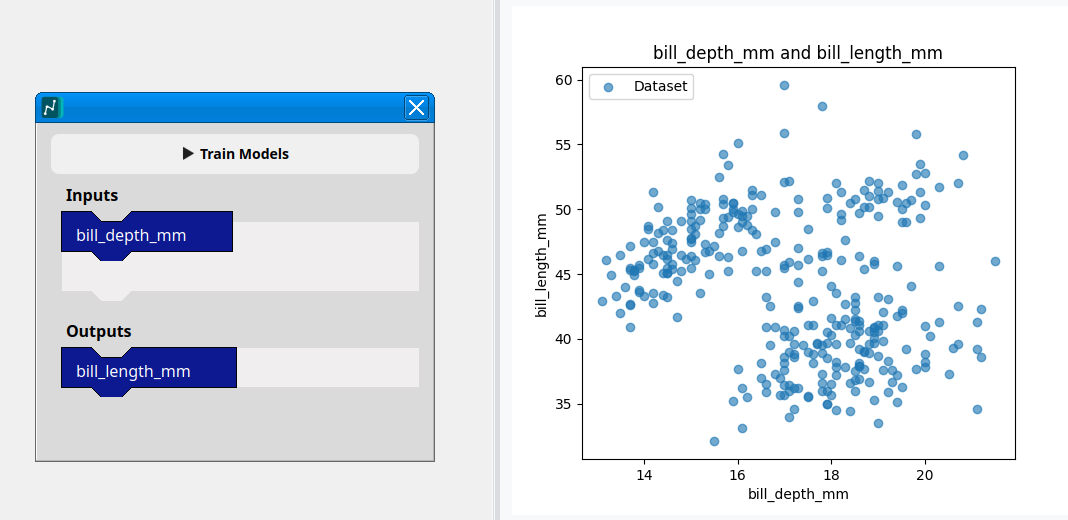
Each dot corresponds to a penguin with the respective features.
.png)
First Model : LinearRegression
The simplest AI model in the world! linear regression! This model looks at the data, and finds a straight line that fits the dataset best!
Lets try it out!
- Click on the “Regressors” tab, this is on the left side of the screen.
- Drag the LinearRegresison to the “model” section on your first pipeline.
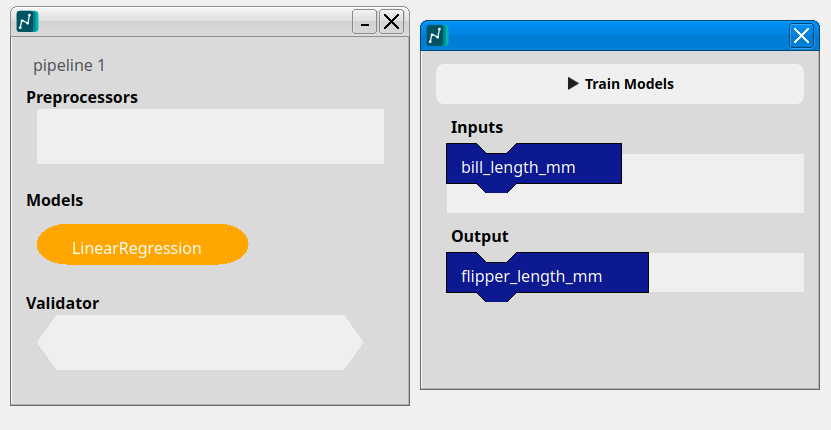
In the plots tab we get the results of our model training! This line is a visual representation of our LinearRegresison model. Each place on the line corresponds to a respective prediction from our AI model!
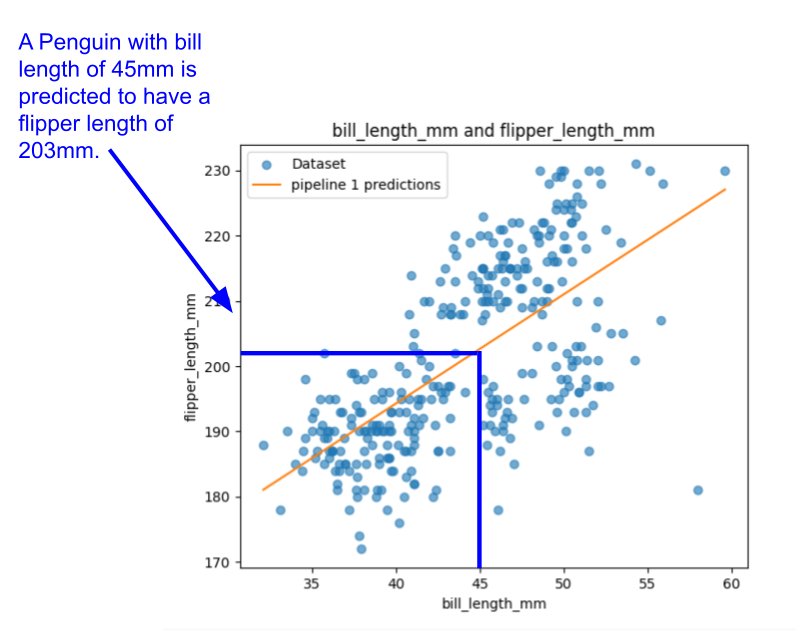
Hooray! We’ve trained and plotted our first AI model!