There are two different types of AI models, 3. Regression and 4. Classification. Both of these fit within the “model” category within the pipeline. Note: Trying to train a regressor and a classifier at the same time will result in an error.
| Regression | Classification | |
|---|---|---|
| Description | Takes in any combination of input data, and outputs a prediction in the form of a number. Example: - Input: bill_length_mm = 39.1 - Output: bill_depth_mm = 181.0 | Takes in any combination of input data, and outputs a prediction in the form of a class. Example: - Input: bill_length_mm = 39.1 - Output: Island = Torgenson |
| Prediction data type | Numerical | Categorical |
| Ways to assess model performance | - RMSE (Root Mean Squared Error) - Explained Varience - | - Accuracy |
Understanding Regression Accuracy
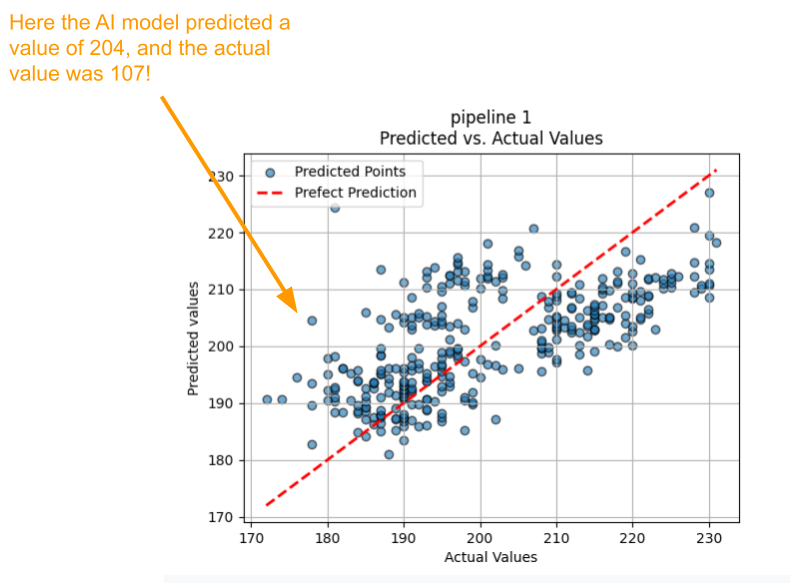
The accuracy graph for the regressor shows the explained accuracy for each data point. The dotted red line represents a perfect prediction. The Y axis(Predicted Values) shows the models predictions, and the X axis(Actual Values) shows the actual values reflected in the training dataset.
This means, the closer the blue dots are to the red line, the better our AI model is performing!
Understanding Classifier Accuracy
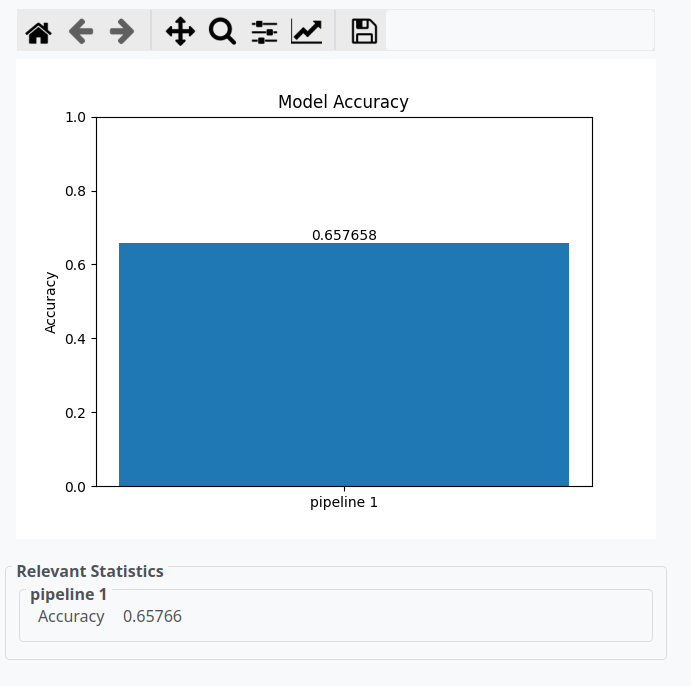
The accuracy plot for the classier shows the percent of predictions that the AI model gets correct.